GNUPLOT demo: errorbar.dem
#
# $Id: errorbar.dem%v 3.38.2.114 1993/04/15 01:48:40 woo Exp woo $
#
# 31 Mar 1993 Modified by Daniel S. Lewart (d-lewart@uiuc.edu)
#
set xrange [-3:65]
set yrange [ 4:14]
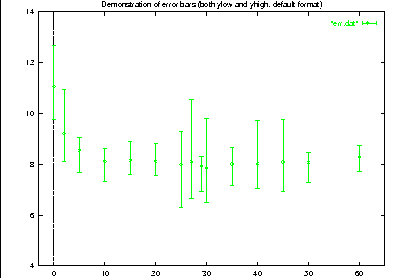
set title "Demonstration of error bars (both ylow and yhigh, default format)"
plot "err.dat" with errorbars
 pause -1 "Hit return to continue"
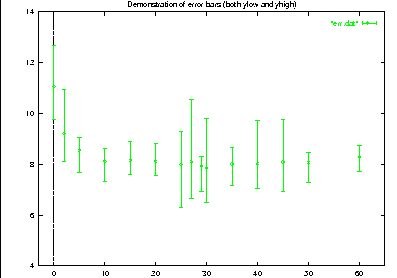
# this should look the same
set title "Demonstration of error bars (both ylow and yhigh)"
plot "err.dat" using 1:2:3:4 with errorbars
 pause -1 "Hit return to continue"
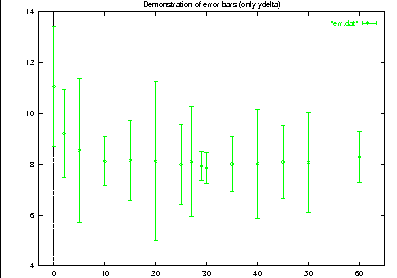
set title "Demonstration of error bars (only ydelta)"
plot "err.dat" using 1:2:5 with errorbars
 pause -1 "Hit return to continue"
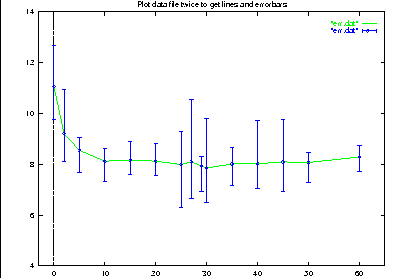
set title "Plot data file twice to get lines and errorbars"
plot "err.dat" with lines, "err.dat" using 1:2:3:4 with errorbars
 pause -1 "Hit return to continue"
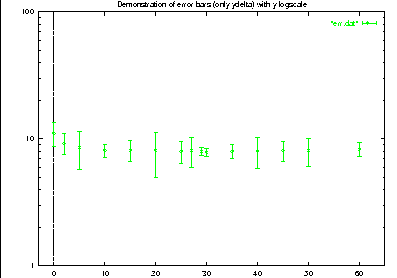
set logscale y
set title "Demonstration of error bars (only ydelta) with y logscale"
plot [-3:65] [1:100] "err.dat" using 1:2:5 with errorbars
 set nologscale y
pause -1 "Hit return to continue"
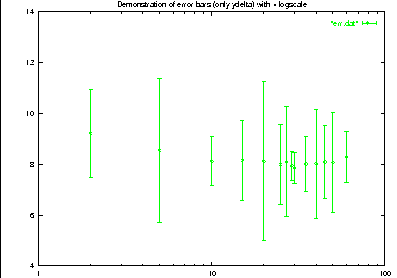
set logscale x
set title "Demonstration of error bars (only ydelta) with x logscale"
plot [1:100] [4:14] "err.dat" using 1:2:5 with errorbars
 set nologscale x
pause -1 "Hit return to continue"
set autoscale
set nologscale
set title ""


